Semi-supervised Echocardiography Video Segmentation via Anchor Semantic Awareness and Continuous Pseudo-label Reforging
IEEE/CVF Conference on Computer Vision and Pattern Recognition (CVPR)
Yunpeng Fang1, Yimu Sun1, Jingxing Guo1, Huisi Wu1*, Jing Qin2
1Shenzhen University
2The Hong Kong Polytechnic University
Abstract
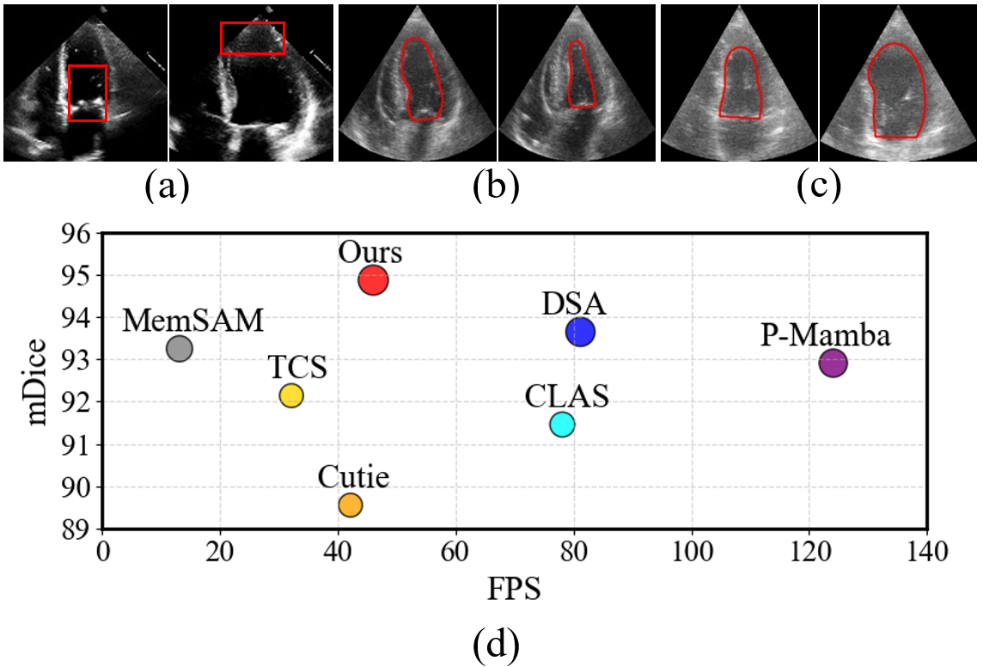
Automatic and accurate echocardiography video segmentation is essential for efficient and repeatable measurements of key clinical functional indicators for the diagnosis of cardiovascular diseases. However, it is an extremely challenging task to obtain high-quality segmentation results throughout the cardiac cycle owing to (1) the inherent speckle noise in echocardiography videos, (2) the complex dynamic motions of cardiac structures, and (3) the scarcity of annotated data. To comprehensively address these challenges, we propose a novel semi-supervised model, EchoForge, which can achieve accurate and real-time echocardiography video segmentation with very limited annotations. EchoForge introduces an Anchor Semantic Awareness (ASA) module that refines ambiguous regions using learnable anchors and propagates structural prototypes across frames to enhance boundary delineation and temporal consistency. Building upon ASA, a Continuous Pseudo-label Reforging (CPR) module progressively integrates and refines pseudo-labels via channel-wise attention, providing robust supervision. Extensive experiments on the CAMUS and EchoNet-Dynamic benchmarks demonstrate that EchoForge outperforms state-of-the-art (SOTA) methods in accuracy while maintaining real-time efficiency.
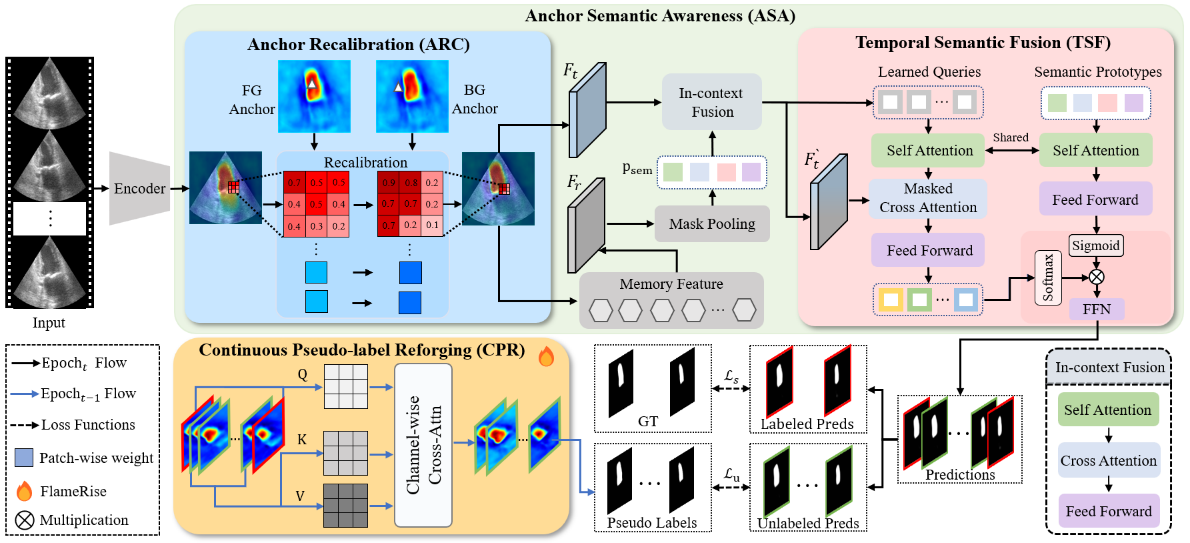
Figure 1: Overview of the proposed EchoForge framework, consisting of the ASA and CPR modules. The ASA module utilizes learnable anchors and semantic awareness to suppress speckle noise, while the CPR module leverages annotated frames to reforge pseudo-labels, providing robust supervision.
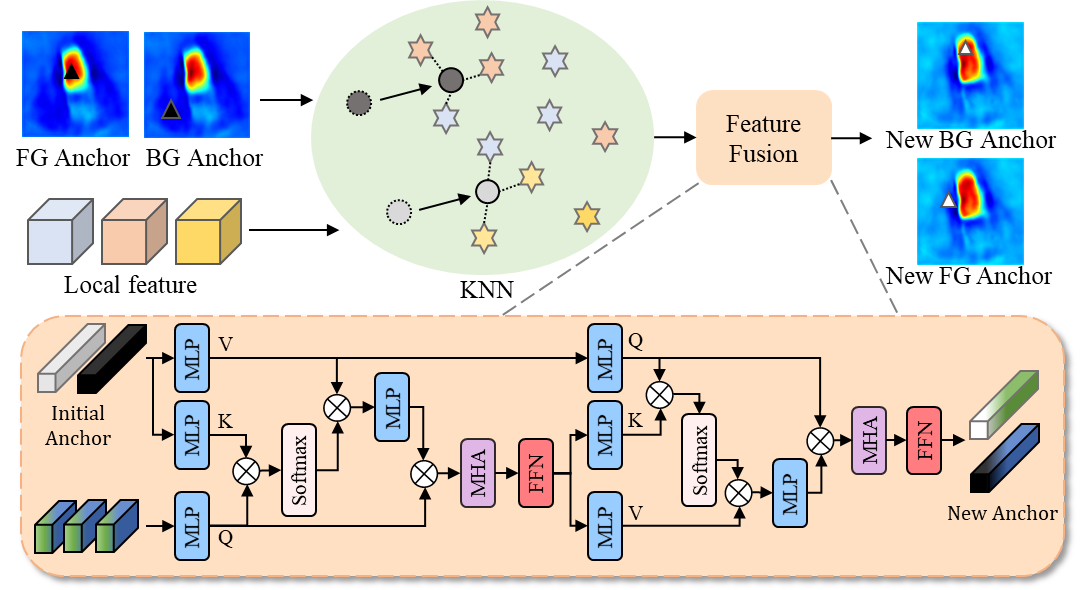
Figure 2: Detailed illustration of the anchor update process. Initial anchors are first filtered with local feature via KNN, and then updated anchors are generated through a Feature Fusion module.
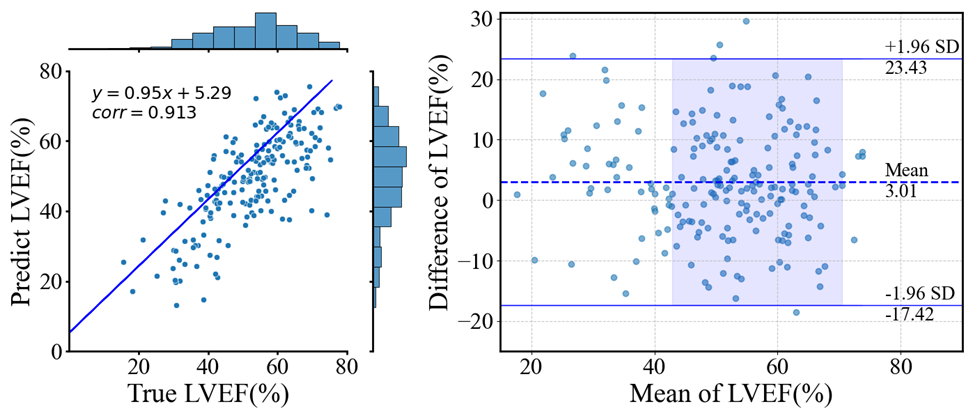
Figure 3: Linear Regression and Bland-Altman plots for the clinical metric LVEF on the CAMUS-Semi test set.
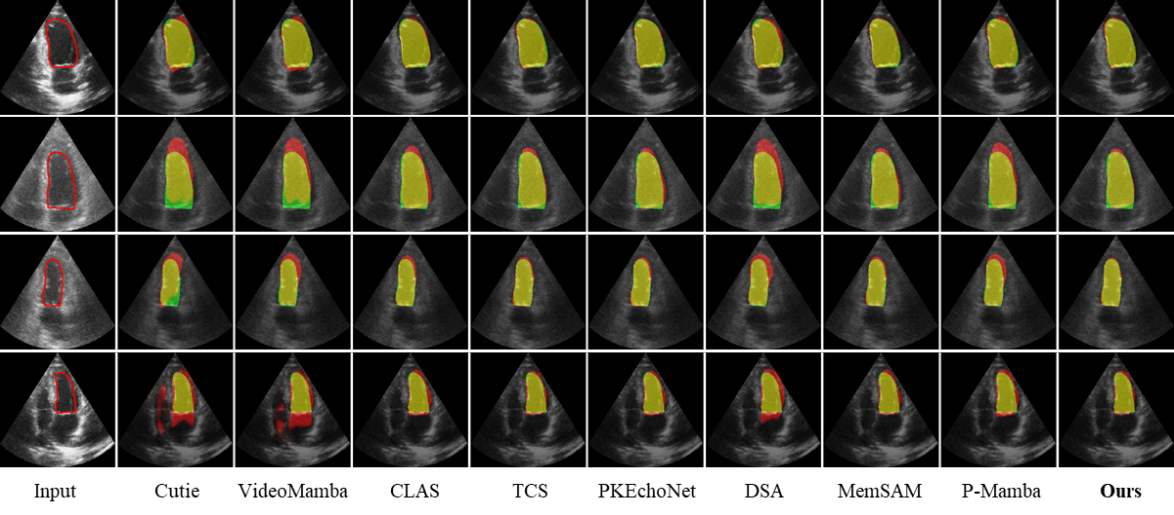
Figure 4: Visual comparison with state-of-the-art methods on the CAMUS-Semi test set. Green, red, and yellow regions represent the ground truth, prediction, and overlapping regions, respectively.
Acknowledgement
This work was supported partly by National Natural Science Foundation of China (No. 62273241), Natural Science Foundation of Guangdong Province, China (No. 2024A1515011946), the Shenzhen Research Foundation for Basic Research, China (No. JCYJ20250604181940054), and the grant under Hong Kong RGC Collaborative Research Fund (project no C5055-24G).
Downloads